

AdrianWarren.com: Reviews: Canon EOS 400D
Lens used: Canon EF 100mm f2.8 Macro USM. Aperture f11 (middle of the sweet spot f9.5-f13, beyond f13 diffraction limited). Chart and methodology from NormanKoren.com, Lenstarg_50_5906p_15g_25is.png printed on plain paper using a Canon S900. Camera to chart distance ~5.2m. Test strip 25cm long.
Please click on the thumbnail chart below to see the fullsize version. The actual measurements were taken from the RAW files converted to TIFF, the charts were then converted to JPEG to minimize download times. For ease of viewing I have rotated the second image of each pair from the vertical orientation to horizontal orientation.
| Canon EOS 350D | |
|
|
| Canon EOS 400D | |
|
|
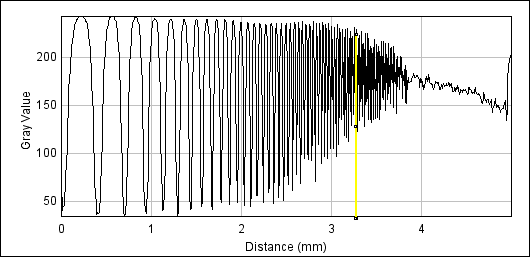
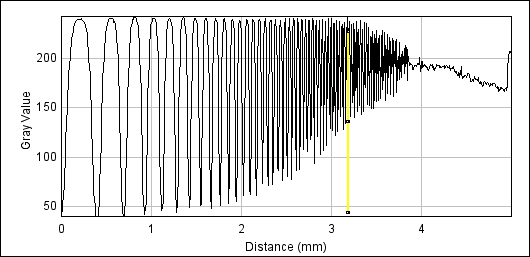
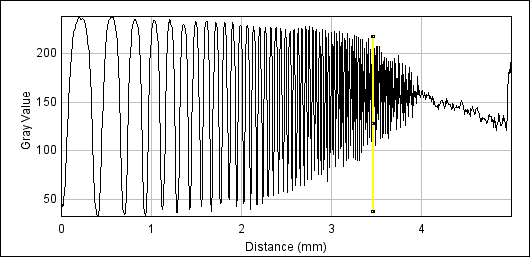
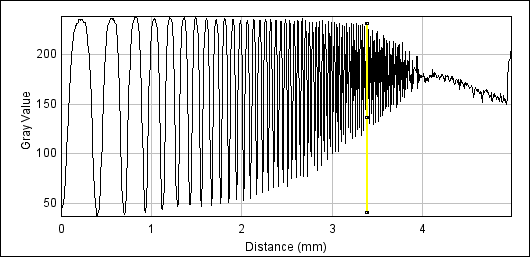
The following plots show intensity on the y-axis, and distance across the chart above on the x-axis. The yellow marker (X) indicates 50% of peak amplitude. From this we can calculate the MTF50 of the camera+lens combined. As we're using a high quality prime lens at the peak of its resolution, and near the centre of the frame, the camera is the resolution limiting factor in this case. This means that effectively the results are for the camera, as the lens has negligible effect on resolution here.

EOS 350D horizontal (X=3.26)

EOS 350D vertical (X=3.19)

EOS 400D horizontal (X=3.45)

EOS 400D vertical (X=3.39)
| Camera | orientation | X | MTF50 |
| EOS 350D | horizontal | 3.26 | 40lp/mm |
| EOS 350D | vertical | 3.19 | 38lp/mm |
| EOS 400D | horizontal | 3.45 | 48lp/mm |
| EOS 400D | vertical | 3.39 | 45lp/mm |
The MTF50 value f is defined as:
f = 2(100)^(X/5)
Whilst this isn't an orders of magnitude improvement over the previous model, it is an improvement nevertheless. It also shows that, at least for the 350D, the 100mm lens isn't the resolution limiting factor.
For more information about the derivation of this formula, and background to the test charts please visit Lens testing @ NormanKoren.com
